
EUR/USD Outlook:
Brexit and US elections Hinder Investor Sentiment
The economic implications of the Coronavirus pandemic continue to weigh down on the world’s two largest economies as the second wave of the virus remains a hindrance to economic recovery. As France and Northern Ireland implement additional lockdown restrictions to curb the intensified number of new Covid-19 related cases, German chancellor Angela Merkel has warned that Germany cannot afford a second lockdown.
This comes at a time where political pressure looms ahead of Brexit as well as the US presidential election.Brexit negotiations are once again underway in a two–day summit being held in Brussels, after Boris Johnson previously stated that today would be the deadline for a deal to be possible. Now, it appears that a decision should be made by the end of the week which may be an additional driver of price action.
Meanwhile, in America, hopes of additional stimulus have faded as US Treasury Secretary, Steve Mnuchin, indicated that it is highly unlikely that a second coronavirus relief bill would be released before the elections on 3 November 2020.
EUR/USD Confined to Key Fibonacci Levels
On the technical front, the weekly chart below highlights how the Fibonacci levels have kept both bulls and bears at bay, providing support and resistance for themajor currency pair. Currently, the 23.6% and 38.2% Fibonacci retracement level from the medium-term move (2 Jan 2017 low to 12 Feb 2018 high), has formed an area of confluency, with price action trading between these levels for the past 3 months. However, after failing to break through the psychological level of 1.2000, prices have retraced back to the 38.2% level at 1.17101.
Starts in:
Live now:
Oct 18
( 22:10 GMT )

James Stanley’s Price Action Webinar
Key News Trading Events for the Week Ahead
EUR/USD Weekly Chart
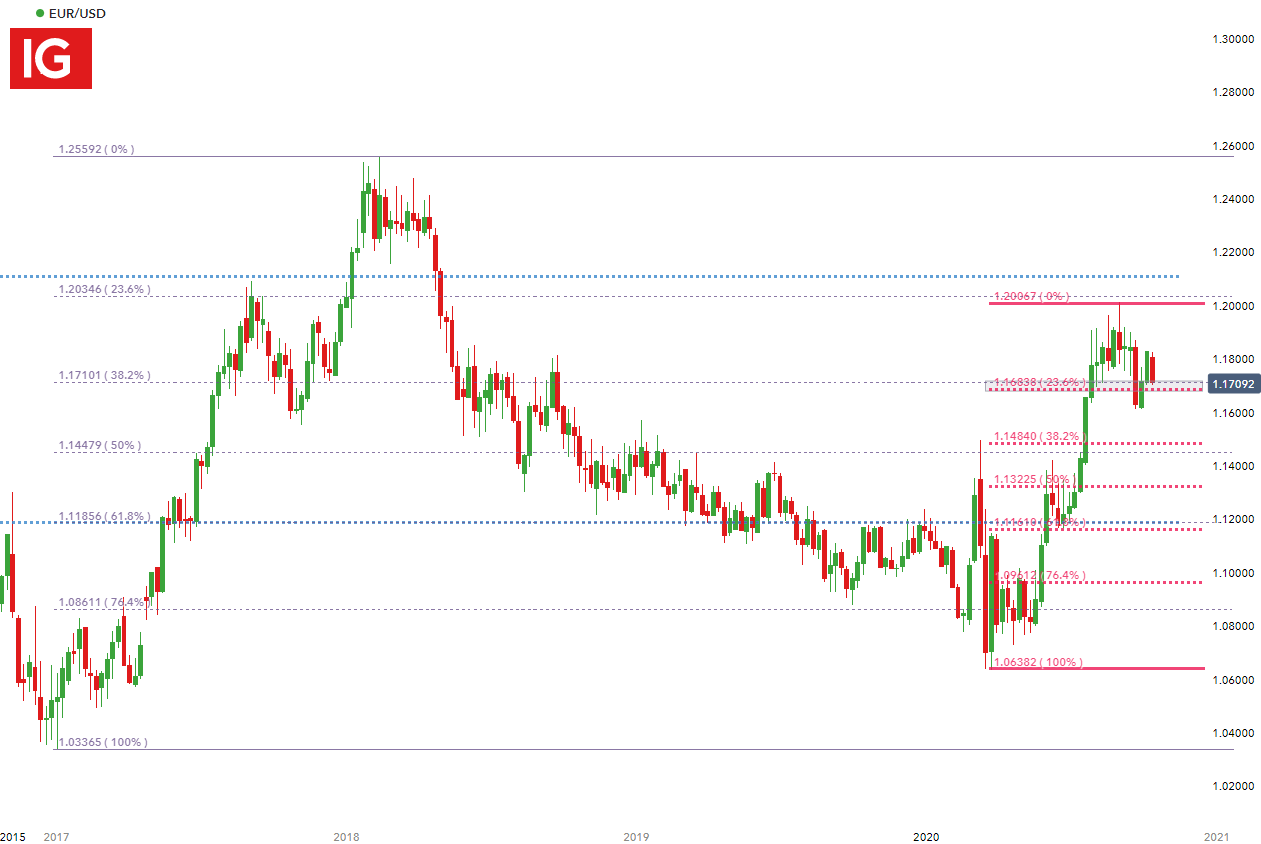
Chart prepared by Tammy Da Costa, IG
MACD Crosses Below Zero as Bear Flag Forms
From a short-term perspective, the daily chart below indicates the possibility of a bear flag formation, with a Doji appearing just below. After a period of consolidation, this may indicate that further downside may occur should prices break below the area of support mentioned above. Meanwhile, the Moving Average Convergence/Divergence (MACD), has crossed below the zero-line, a possible indication that the pair may be in oversold territory or that the momentum of the downtrend may be slowing down.

Recommended by Tammy Da Costa
What is the biggest mistake made by traders?
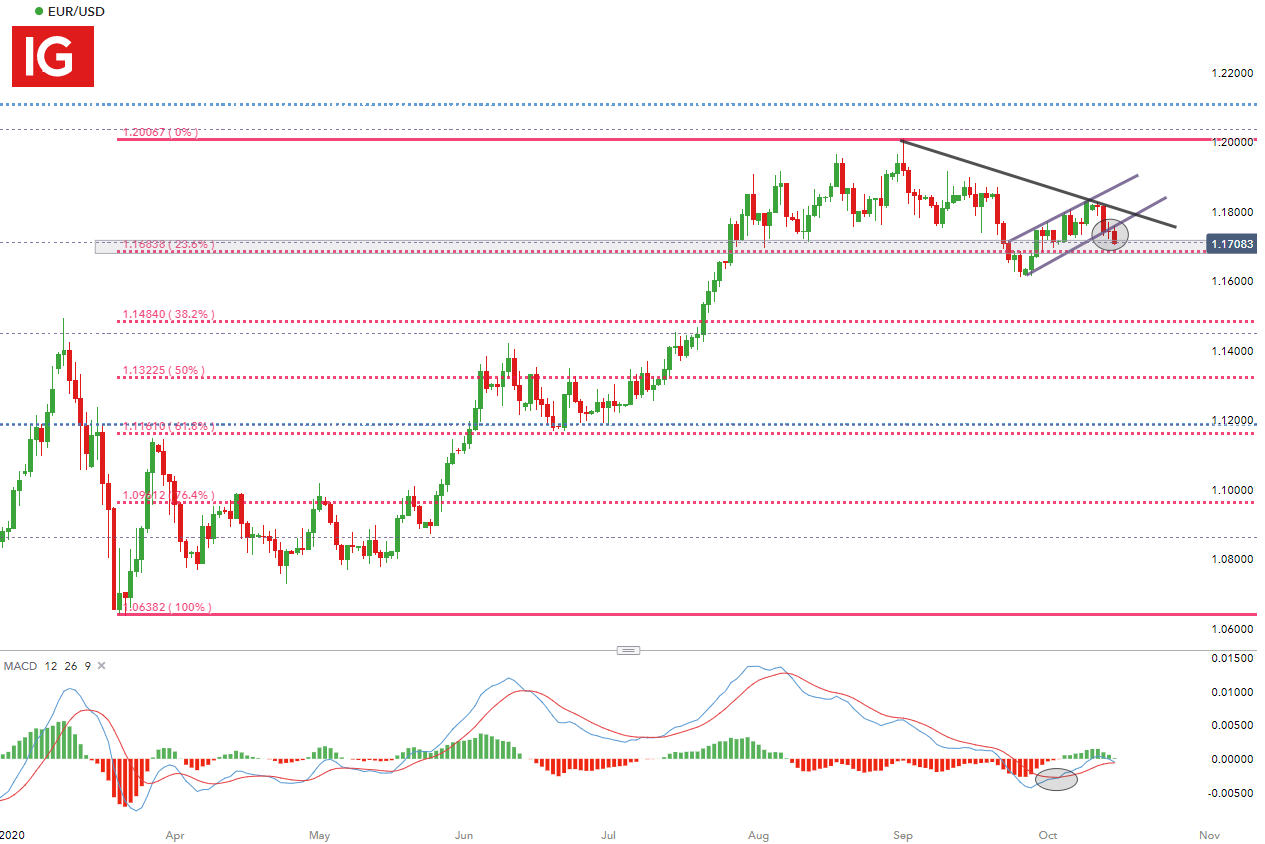
Chart prepared by Tammy Da Costa, IG
EUR/USD Strategy Ahead
Should bulls manage to break away from current support, the next resistance level may be found at 1.1750 which provided support for the pair between July and September. If prices rise above this level, the psychological level of 1.18, will be the next level of interest.
On the contrary, should bears maintain favor, pushing below current support, the 23.6% retracement of the short-term move (March 2020 low to September 2020 high), may provide additional support at 1.16838, with 1.16 being the next support level.
— Written by Tammy Da Costa, Market Writer for DailyFX.com
Contact and follow Tammy on Twitter: @Tams707