
Canadian Dollar Talking Points
USD/CAD carves a bullish outside day (engulfing) candle formation as it bounces back from a fresh monthly low (1.3099), but recent developments in the Relative Strength Index (RSI) cast a bearish outlook for the exchange rate as the indicator establishes a downward trend in October.
USD/CAD Bullish Outside Day Price Formation Indicates Larger Rebound
USD/CAD struggled to retain the advance from the September low (1.2994) as the rebound failed to produce a test of the August high (1.3451), with the RSI snapping the upward trend from September as the US Dollar weakened on the back of improving risk appetite.
Looking ahead, key market trends may continue to influence USD/CAD as the Greenback shows an inverse relationship with the investor confidence, and it remains to be seen if the improvement in risk appetite will carry into the end of the month as US President Donald Trumpinsists “Covid Relief Negotiations are moving along.”
However, USD/CAD may trade within a more defined range as the bullish outside day (engulfing) candle formation points to a larger rebound, and the exchange rate may consolidate ahead of the next Federal Reserve interest rate decision on November 5 as the central bank prepares a “more explicit outcome-based forward guidance.”
The Federal Open Market Committee (FOMC) may show a greater willingness to further support the US economy as Chairman Jerome Powell and Co. remain “committed to using the Federal Reserve’s full range of tools in order to support the U.S. economy,” but it seems as though the central bank is in no rush to deploy more non-standard tools as most Fed officials judged that “yield caps and targets would likely provide only modest benefits in the current environment.”
In turn, the Fed may tweak its current tools to generate a stronger recovery as Cleveland Fed President Loretta Mester, a 2020 voting-member on the FOMC, states that the committee could “shift to longer-term Treasuries, as we did during the Great Recession, if we needed more accommodation,” and the unprecedented efforts taken by major central banks may continue to shore up investor confidence as the Fed’s balance sheet approaches the peak from June.
As a result, key market trends look poised to persist as the crowding behavior in USD/CAD carries into October, with traders net-long the pair since mid-May.
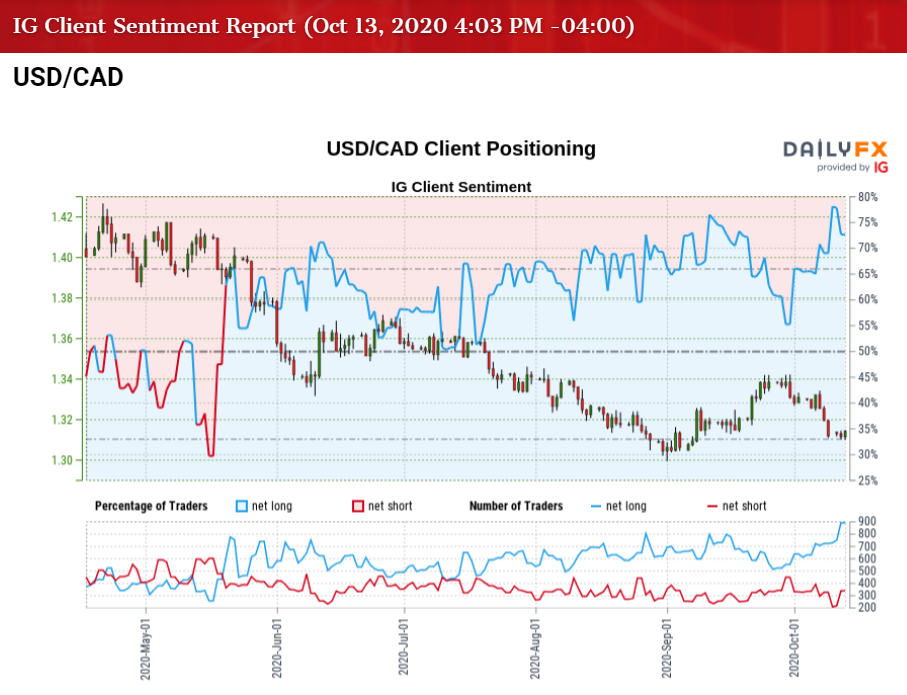
The IG Client Sentiment report shows 75.93% of traders are net-long USD/CAD, with the ratio of traders long to short standing at 3.15 to 1. The number of traders net-long is 4.28% higher than yesterday and 11.63% higher from last week, while the number of traders net-short is 13.60% lower than yesterday and 20.11% lower from last week.
The decline in net-short position could be a function of profit-taking behavior as USD/CAD bounces back from a fresh monthly low (1.3099), but the rise in net-long interest has spurred a greater tilt in retail sentiment as 67.15% of traders were net-long the pair last week.
With that said, the crowding behavior looks poised to persist even though USD/CAD struggles to retain the advance from the September low (1.2994), and the Relative Strength Index (RSI) undermines the recent rebound in exchange rate as the indicator establishes a downward trend in October.

Recommended by David Song
Learn More About the IG Client Sentiment Report
Sign up and join DailyFX Currency Strategist David Song LIVE for an opportunity to discuss potential trade setups.
USD/CAD Rate Daily Chart
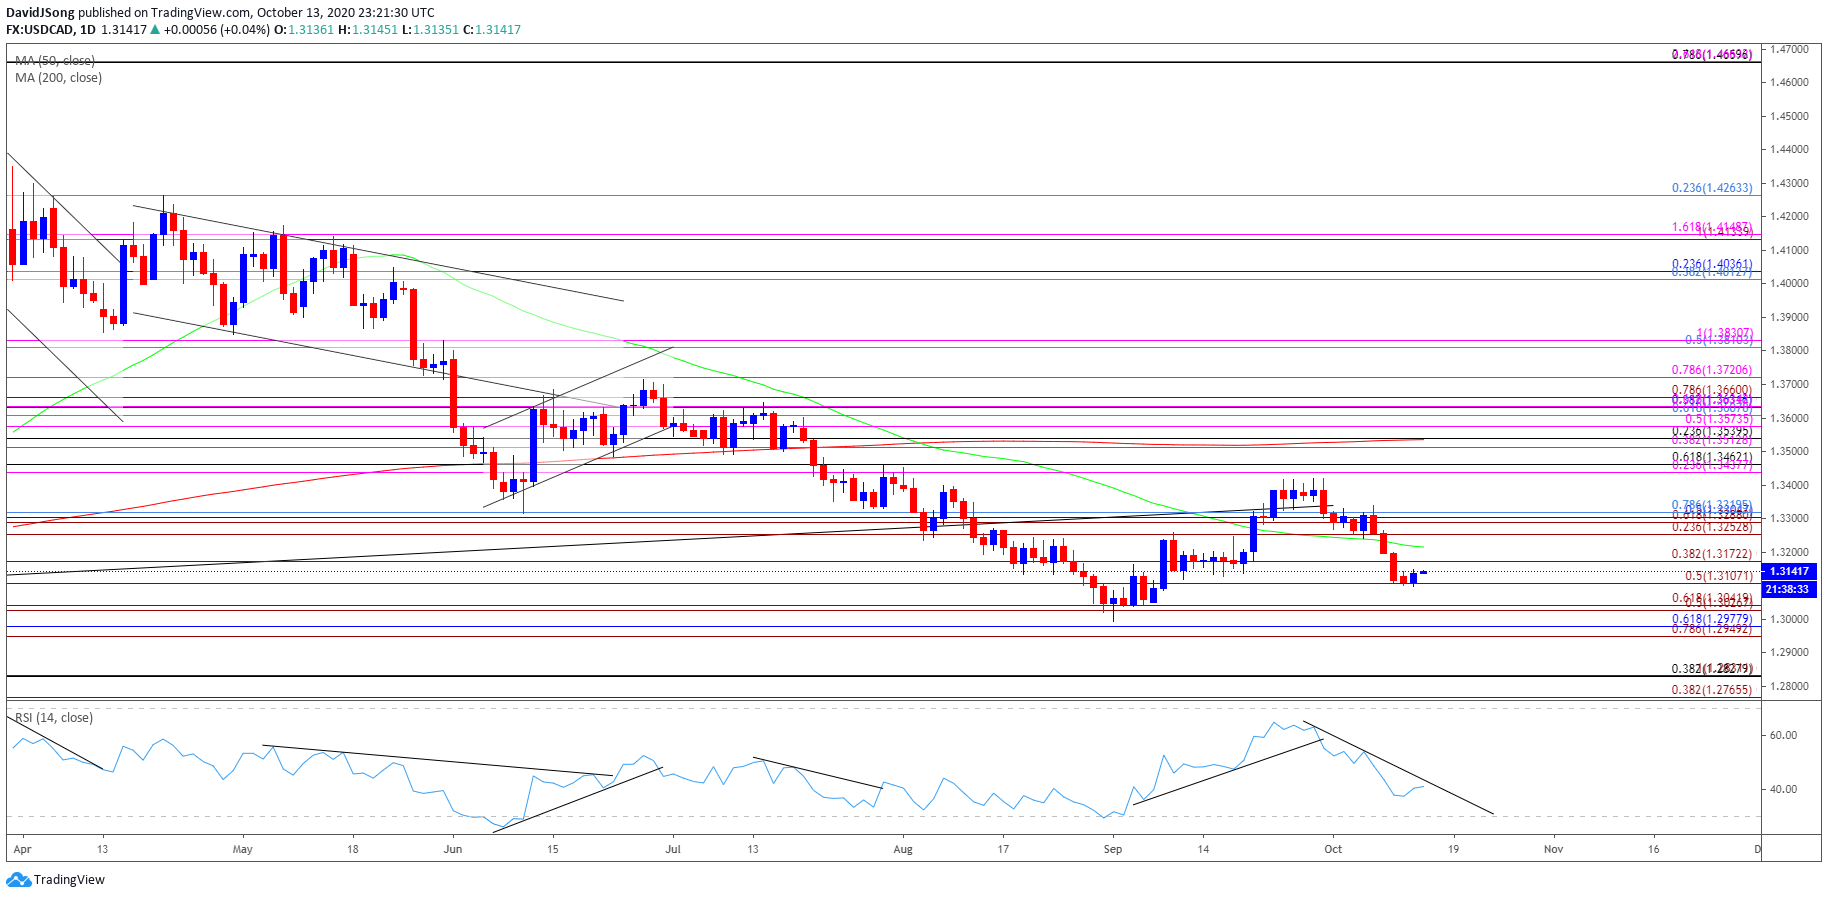
Source: Trading View
- Keep in mind, the USD/CAD correction from the 2020 high (1.4667) managed to fill the price gap from March, with the decline in the exchange rate pushing the Relative Strength Index (RSI) into oversold territory for the first time since the start of the year.
- USD/CAD managed to track the June range throughout July as the RSI broke out of a downward trend, but the failed attempt to push back above the 1.3440 (23.6% expansion) to 1.3460 (61.8% retracement) region led to a break of the March/June low (1.3315) even though the momentum indicator failed to push into oversold territory.
- The decline from the August high (1.3451) briefly pushed the RSI below 30, but lacked the momentum to produce a test of the January low (1.2957) as the indicator failed to reflect the extreme reading in June.
- In turn, the advance from the September low (1.2994) pushed USD/CAD above the 50-Day SMA (1.3238) for the first time since May, but the exchange rate appears to have reversed coursed following the failed attempt to test the August high (1.3451), which largely lines up with the 1.3440 (23.6% expansion) to 1.3460 (61.8% retracement) region.
- The RSI highlights a similar dynamic as the indicator flops ahead of oversold territory and snaps the upward trend established in September, with a break/close below 1.3250 (23.6% expansion) bringing the 1.3170 (50% expansion) region on the radar as the bullish momentum abates.
- Next area of interest coming in around 1.3110 (50% expansion) followed by the Fibonacci overlap around 1.3030 (50% expansion) to 1.3040 (61.8% expansion).

Recommended by David Song
Traits of Successful Traders
— Written by David Song, Currency Strategist
Follow me on Twitter at @DavidJSong