
Australian Dollar, AUD/USD, Chinese Industrial Production, US Election, Fiscal Stimulus – Talking Points
- Australian Dollar weakened on fading Chinese industrial profits
- Rising Covid-19 cases, US fiscal stimulus stalemate are key risks
- AUD/USD technical outlook seems to be favoring the downside
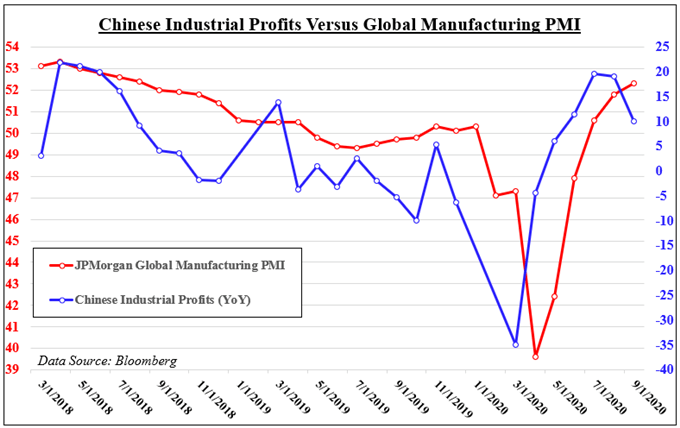
The Australian Dollar cautiously weakened after Chinese industrial profits rose 10.1 percent y/y in September. This is down by about half from 19.1% last month when the reading hovered around its highest in over 2 years. Could this be part of a narrative highlighting fading local economic activity? Just last week, Chinese third-quarter GDP slightly disappointed as the y/y growth rate clocked in at 4.9% versus 5.5% anticipated.

Recommended by Daniel Dubrovsky
What is the road ahead for the Australian Dollar in Q4?
Still, industrial profits are around their highest since early 2019. Overall, the data series is coinciding with improving economic trends in global industrial activity – see chart below. The JPMorgan Global Manufacturing PMI reading touched its highest in 2 years for the same month industrial profits were recorded. In the former, readings above 50 indicate expansion while those below it mark contraction.
As a sentiment-linked currency, the Australian Dollar could benefit should the outlook for global growth improve. China is also Australia’s largest trading partner, opening the door to economic spillovers. This is why the Aussie can at times be sensitive to data out of the world’s second-largest economy. Having said that, there are some roadblocks ahead that could put a brake on the road to recovery.
The rise in Covid-19 cases globally as of late is one thing if lockdown measures are reintroduced such as what occurred in Italy and Spain. All eyes also remain on the United States where policymakers are in a stalemate over another fiscal package before the November 3rd presidential election. Concerns about the expediency of such a measure likely plunged equities and dent the Aussie on Monday.
Australian Dollar Technical Analysis
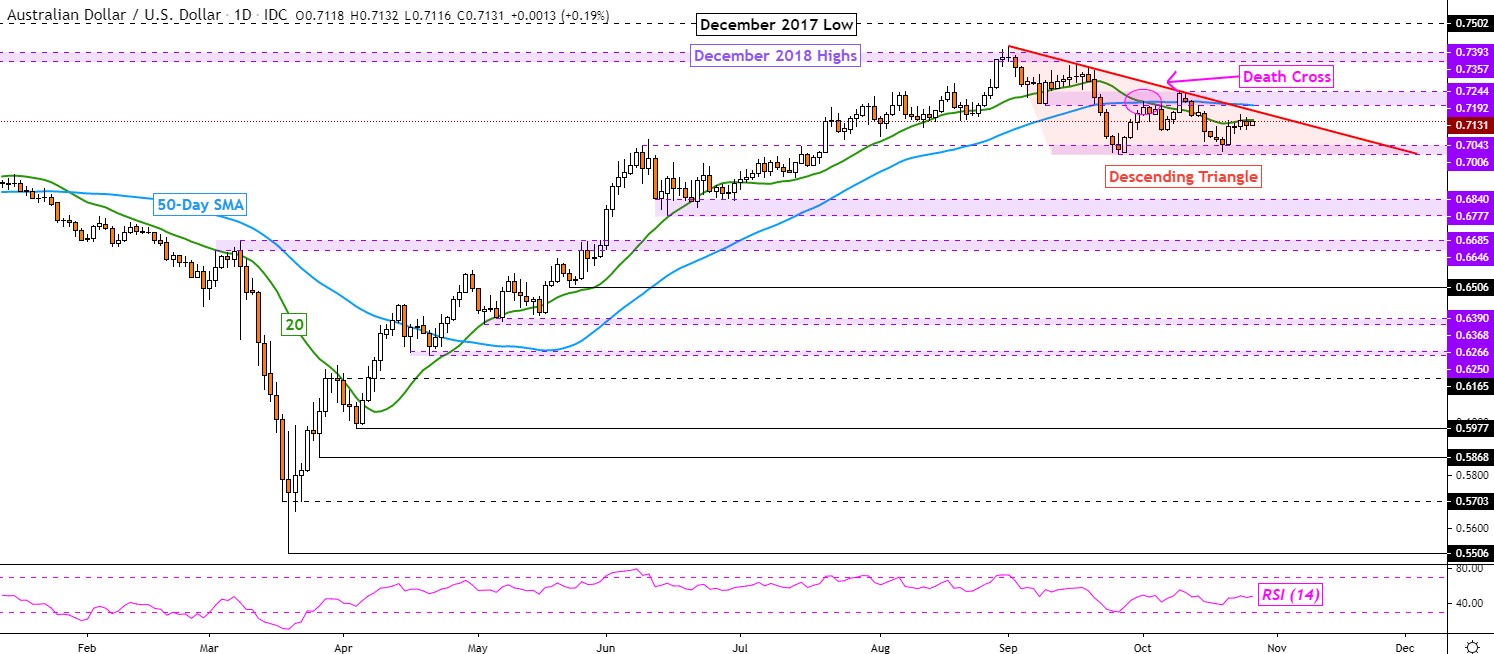
From a technical standpoint, AUD/USD could be at risk of losses ahead. The pair is trading within a bearish Descending Triangle chart pattern after the formation of a ‘Death Cross’. The latter popped up after the 20-day moving average crossed under the 50-day one in September. A breakout under the floor of the triangle at 0.7006 could open the door to testing lows from June.
| Change in | Longs | Shorts | OI |
| Daily | 2% | 1% | 2% |
| Weekly | -24% | 18% | -6% |
AUD/USD Daily Chart
— Written by Daniel Dubrovsky, Currency Analyst for DailyFX.com
To contact Daniel, use the comments section below or @ddubrovskyFX on Twitter