
Nasdaq 100 Price Outlook:
- Equity price action has stagnated following the drawdown in volatility after the Presidential election
- While coronavirus vaccine news continues to buoy sentiment, gains in many stocks have also slowed
- Nasdaq Trading Basics: How to Trade Nasdaq 100
Nasdaq 100 Forecast: Tech Stock Gains Slow as Volatility Ebbs
The Nasdaq 100 has forfeited its status as the leader in equity price gains this month following a drawdown in volatility and a slight change in the fundamental landscape. While the tech-heavy index boasts an impressive gain of roughly 7% in the month-to-date, the Dow Jones has climbed more than 11% in the same period. Elsewhere, the small-cap Russell 2000 index has climbed an incredible 18% in November alone.
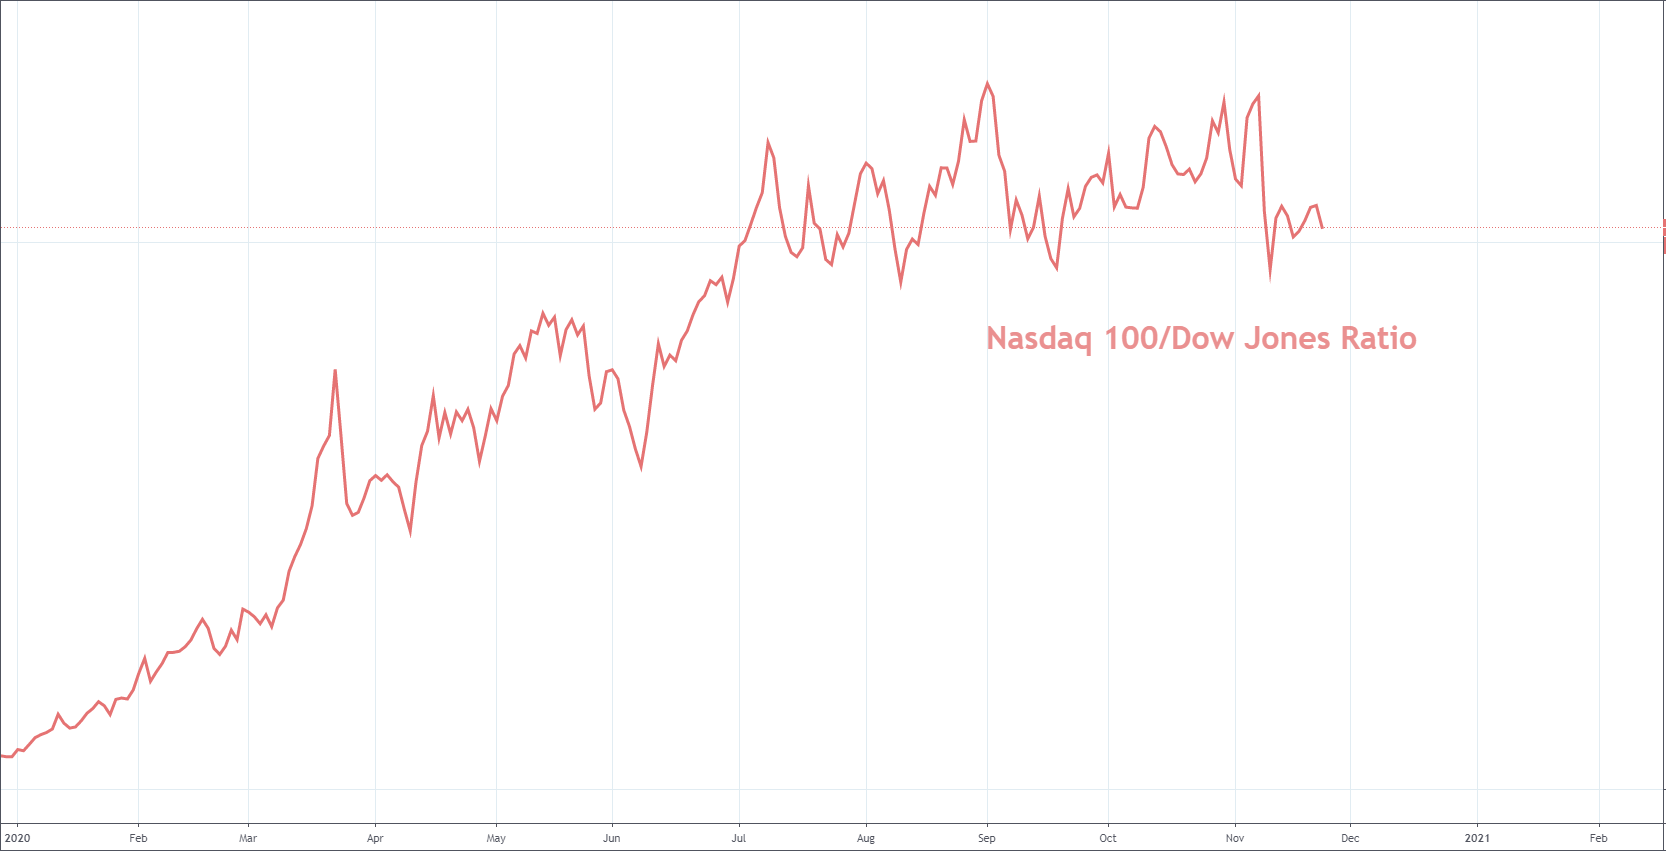
Chart created in TradingView
Consequently, the Nasdaq 100 to Dow Jones ratio rests near the lowest levels of the last five months, highlighting the recent shift in demand amongst equity traders. Still, this is not to say the outlook has changed entirely as the broader direction of all US indices, and indeed even those abroad, seems to be higher at this time. Clearly the potential development of a coronavirus vaccine has played a role in this recent shift, but seasonality may be an underappreciated influencer of recent price action.
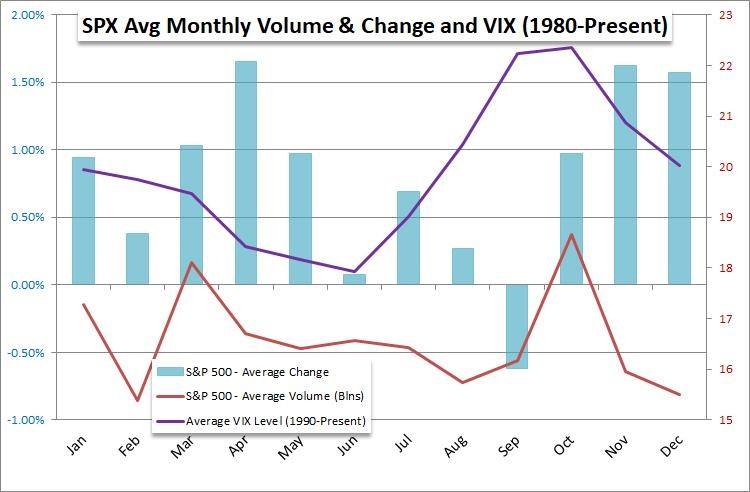
Source: Bloomberg & John Kicklighter
According to data since 1980, October typically marks the height of market volatility on average – as measured by the VIX – with subsequent months seeing a gradual decline in the market’s “fear gauge.” That being said, November and December generally bode well for the S&P 500, Nasdaq 100 and Dow Jones with both months boasting a positive return on average over the last forty years. Thus, it could be argued the recent slowdown in price action is within the realm of broader seasonal trends – a potentiality only exacerbated by election-related uncertainty.
Nasdaq 100 Price Chart: 4 – Hour Time Frame (September – November)
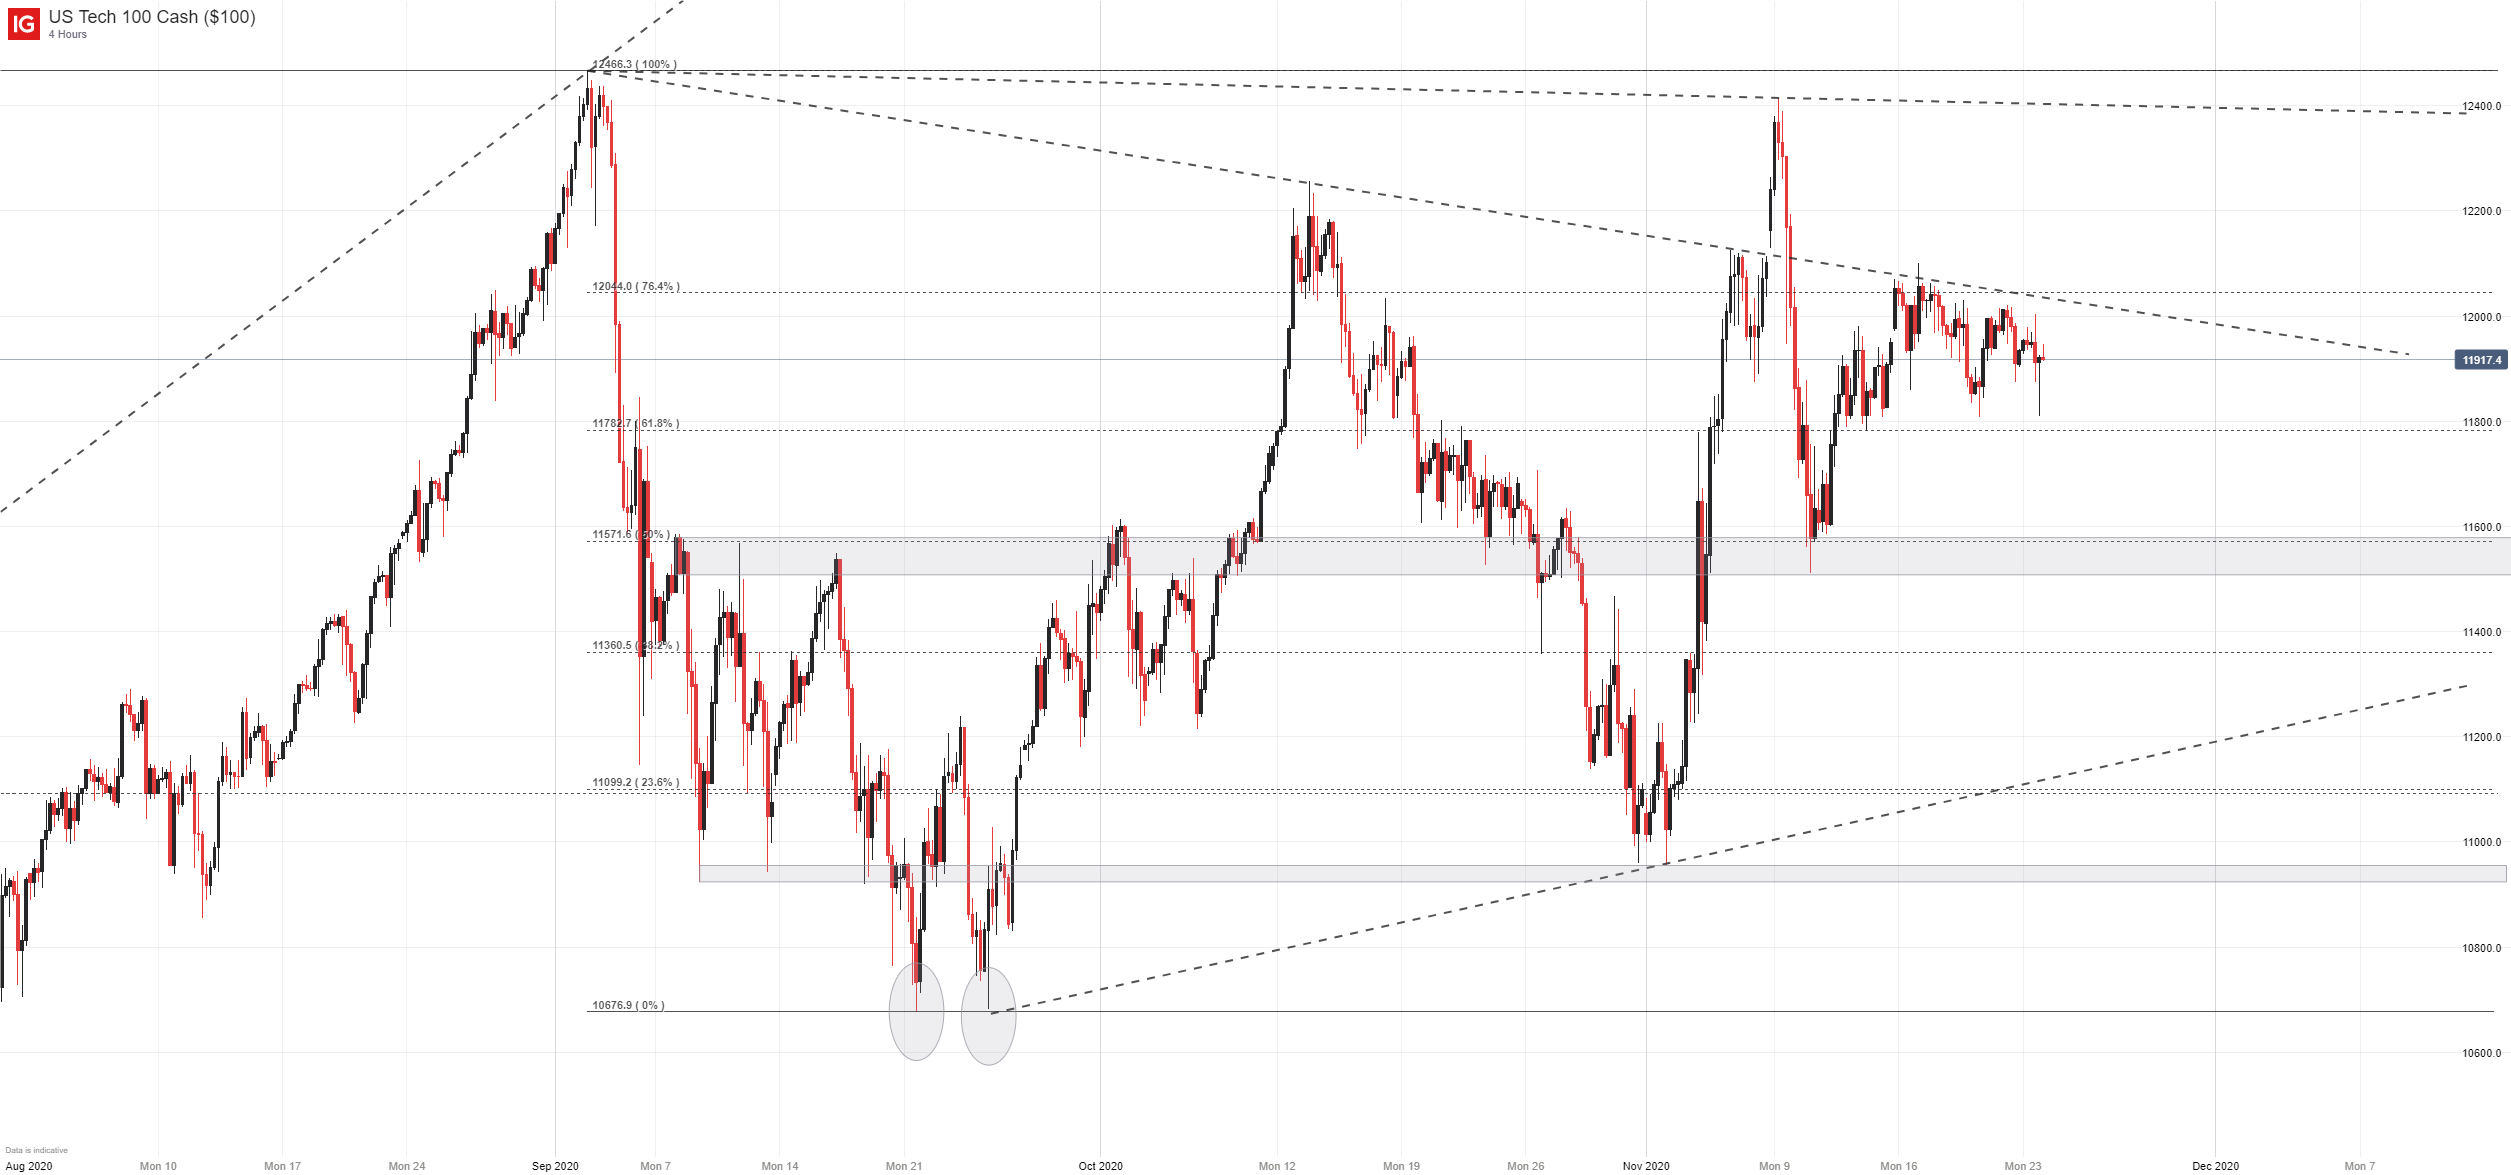
With that in mind, the Nasdaq 100 remains in an encouraging position looking to the months ahead. While coronavirus vaccine headlines have helped spark a rotation in some sectors, the uptake on a potential vaccine will likely take months to achieve which might leave some of the recent sector favorites vulnerable to weakness in the medium-term. Either way, it seems the Nasdaq 100 is tilted higher at this time, despite other indices outpacing it in November.
–Written by Peter Hanks, Strategist for DailyFX.com
Contact and follow Peter on Twitter @PeterHanksFX