
ASX 200, NIKKEI 225 INDEX OUTLOOK:
- All three major US indices tumbled over 3% on virus resurgence and lockdown concerns
- VIX Volatility Index soared to a six-week high amid souring sentiment, the US Dollar Index climbed
- ASX 200 and Nikkei 225 index faces intense selling pressure due to external headwinds
ASX 200 Index Outlook:
Australia’s ASX 200 index opened 1.7% lower on Thursday, following a broad selloff in the US equity markets overnight. France imposed a nationwide lockdown and Germany is likely to put stricter social distancing measures in view of a rapid increase in coronavirus cases across the region. Hospital capacity is one of the top concerns. Risk sentiment might remain downbeat until a clear tipping point is observed in the virus trend or an effective vaccine is developed and becomes available to the public.
The VIX Volatility Index, which is perceived as a gauge of market fear, has soared to 35.0 from 31.8 overnight – see IG chart below. This marks the highest level of equity market volatility observed since early September. The volatility is likely to stay at elevated levels through next week’s US election, which is another major event risk.
Wall Street continued to deliver upbeat Q3 earnings, which were somewhat offset by overwhelming virus concerns. 36 out of 41 S&P 500 index constituents, which unfolded Q3 results on October 28th, have beaten analysts’ forecasts in terms of their earnings per share (EPS). So far in the earnings season, more than 80% of major US corporations have delivered better-than-expected results.
VIX Volatility Index – Daily
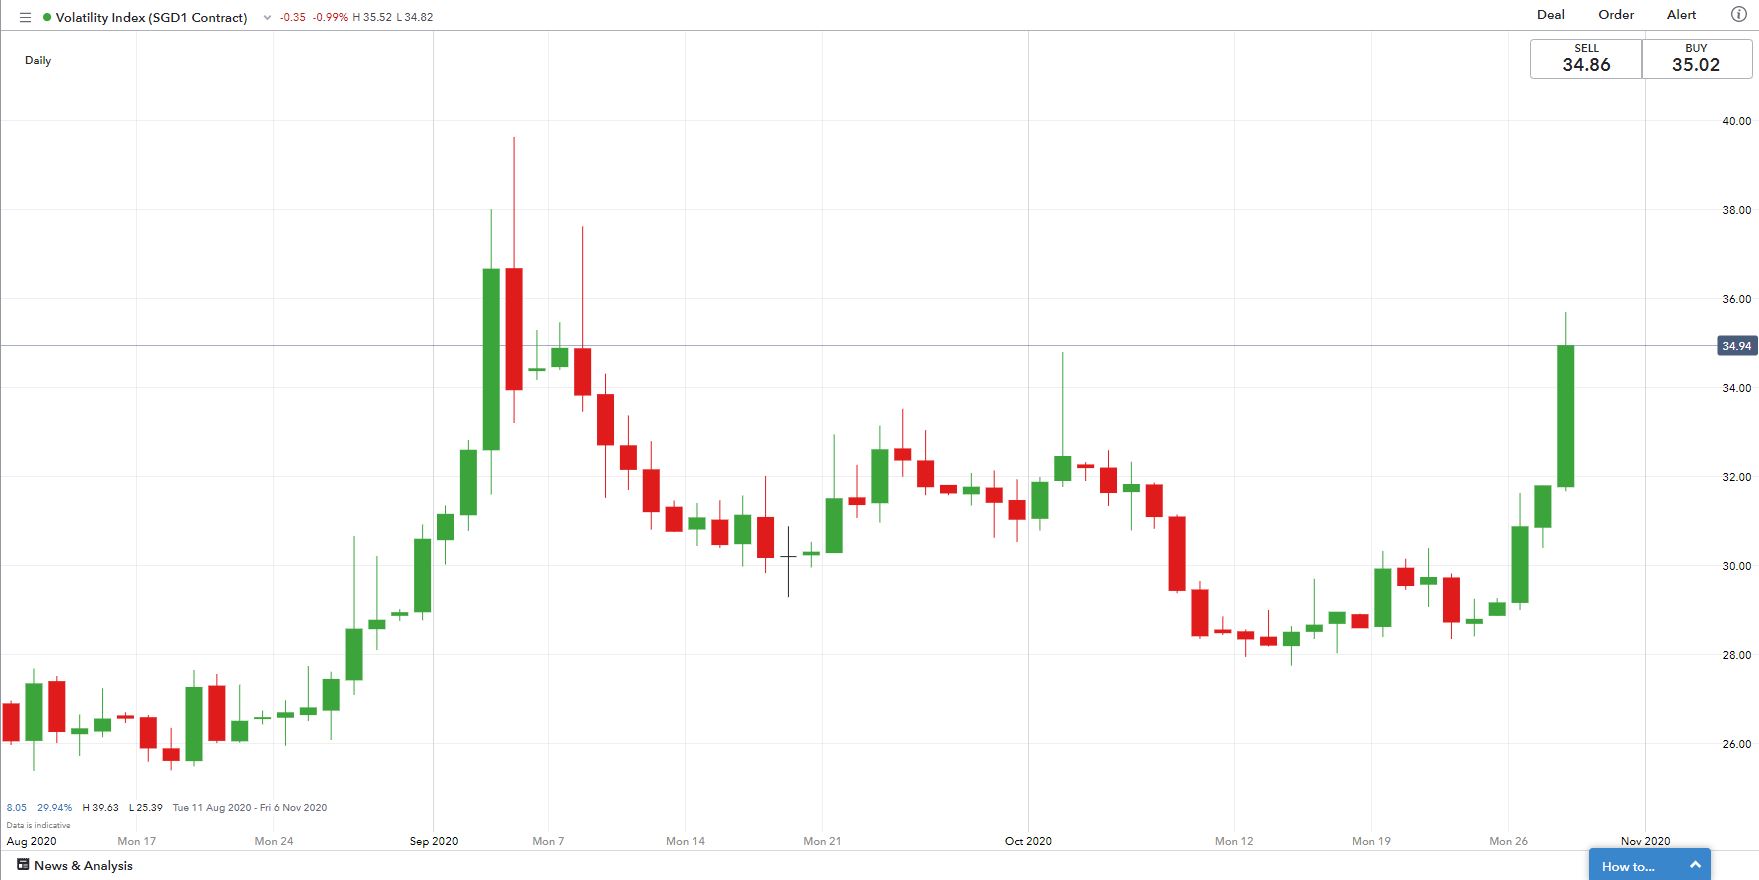
Source: IG

Recommended by Margaret Yang, CFA
What is the road ahead for equities this quarter?
Asia-Pacific markets are set to trade broadly lower following US and European leads, but may suffer to a lesser extend due to relatively better-managed virus situations in the region. Crude oil prices slumped 4 days in a row, weighed by virus concerns and a much higher-than-expected rise in US crude stockpiles. According to EIA reports, US crude oil inventory climbed by 4.32 million barrels in the week ending October 23rd, much higher than a 1.23 million forecast. Falling crude oil prices may exert downward pressure on the energy sector and commodity-linked currencies like the Canadian Dollar and the Norwegian Krone.
On the macro front, the BOJ and ECB will both announce interest rate decisions and give forward guidance on their monetary policy today. US Q3 advanced GDP reading will be in focus too. Find out more on our economic calendar.

Recommended by Margaret Yang, CFA
Why do interest rates matter for currencies?
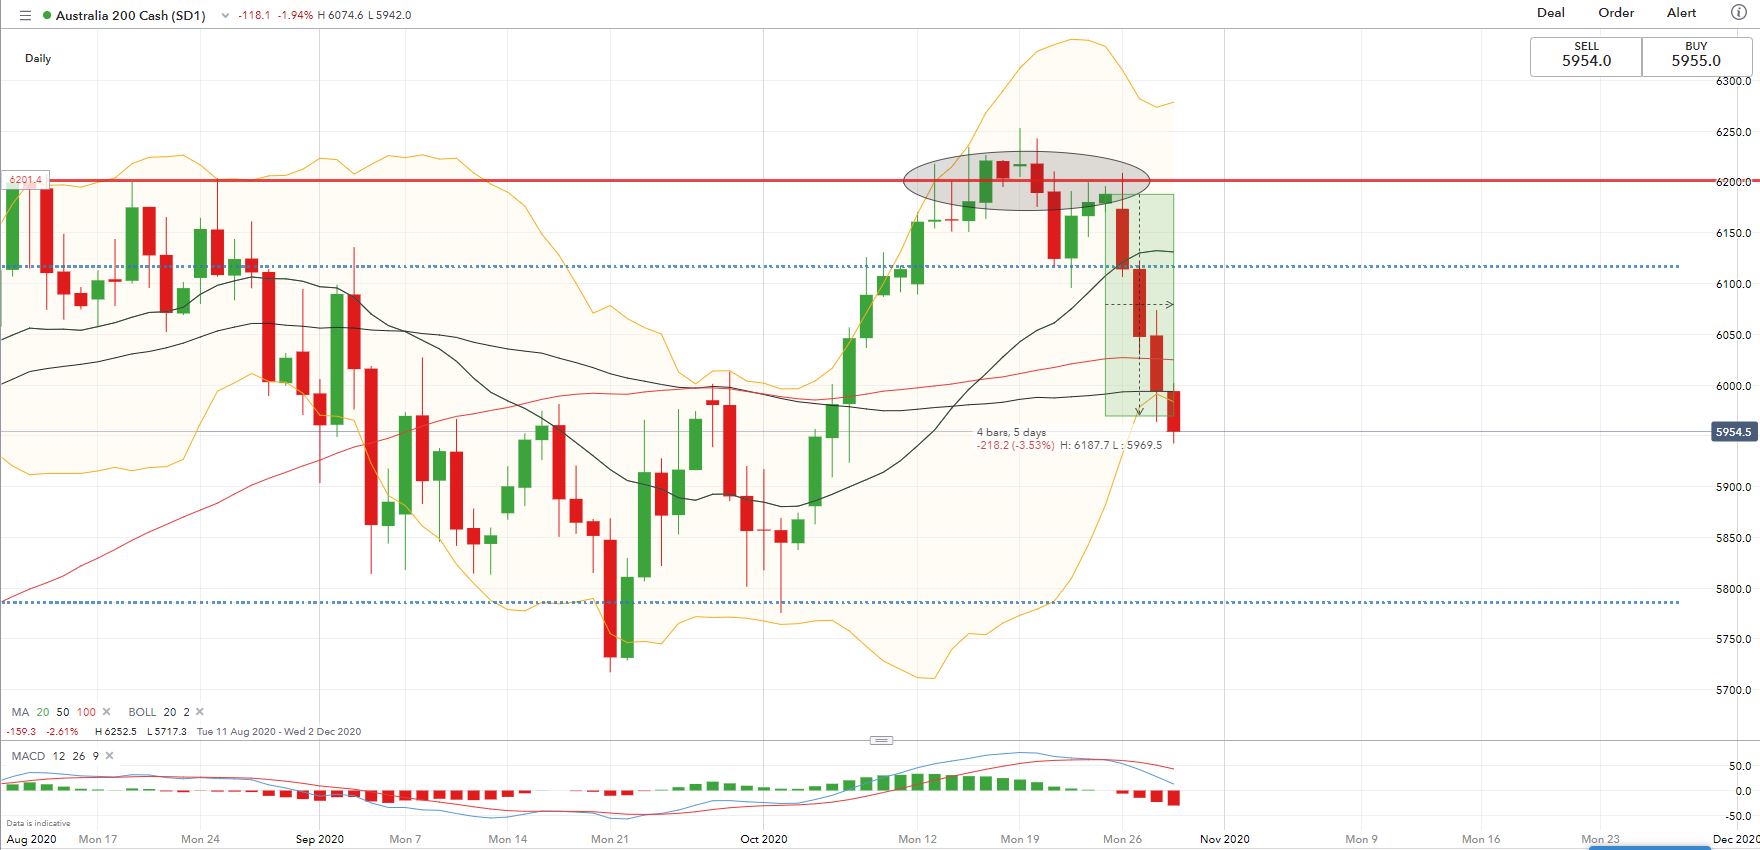
Technically, the ASX 200 index has likely entered into a technical correction. It broke down the 20-, 50- and 100-Day Simple Moving Average (SMA) lines this week, suggesting that downward pressure is prevailing. An immediate support level can be found at 5,800 – the 50% Fibonacci retracement (chart below).
The MACD indicator formed a “Death Cross” and prices have been trending lower since, showing strong bearish momentum. The index price has hit the lower Bollinger Band and pierced through it, signaling strong selling pressure in the near term.
ASX 200 Index – Daily Chart
Nikkei 225 Index Outlook:
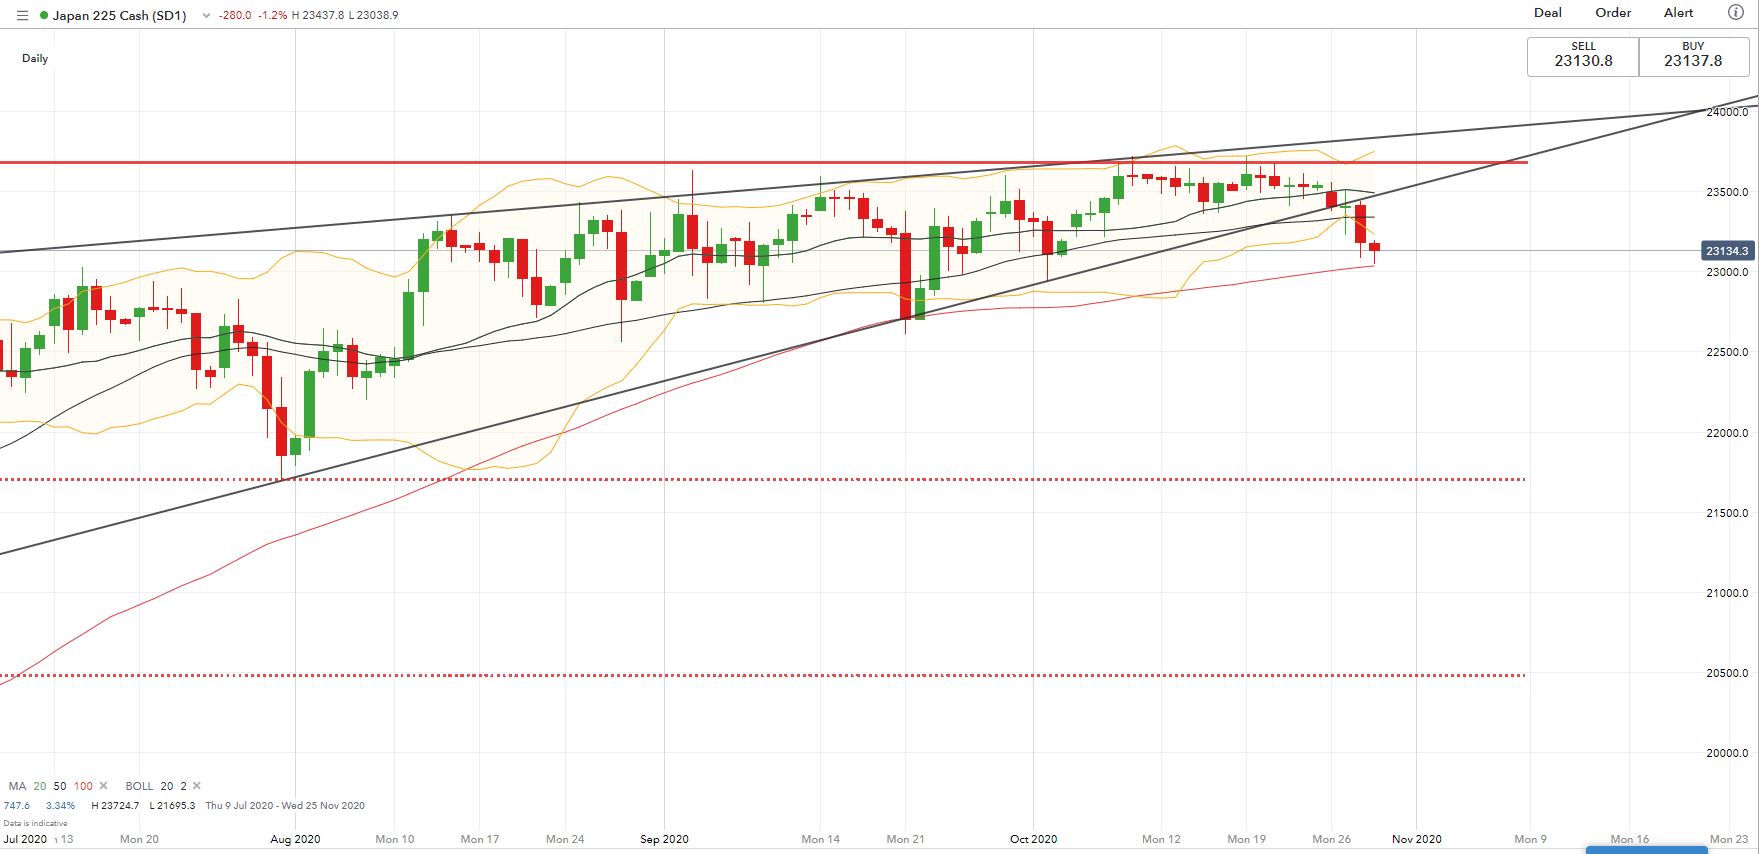
Technically, the Nikkei 225 index has likely entered a technical correction with an immediate support level found at 23,000 – the 100-Day SMA line (chart below). The index has likely broken under a “Rising Wedge” which has been forming since June, and thus has opened the room for further downside. Breaking below 23,000 support may signal further losses with an eye on 22,700 and then a major support level at 21,690 – the 23.6% Fibonacci retracement.
Nikkei 225 Index – Daily Chart

Recommended by Margaret Yang, CFA
Improve your trading with IG Client Sentiment Data
— Written by Margaret Yang, Strategist for DailyFX.com
To contact Margaret, use the Comments section below or @margaretyjy on Twitter