
S&P 500 PRICE OUTLOOK: STOCKS SEARCH FOR SUPPORT AMID LESS EXPECTED ELECTION VOLATILITY, FISCAL STIMULUS ‘CAN-KICKING’
- S&P 500 dropped for the third-straight session owing to less fiscal stimulus optimism
- Major stock indices have faced selling pressure as investor sentiment softens broadly
- VIX Index compression could support stocks in light of reduced US election uncertainty
The S&P 500 Index declined by 0.15% on Thursday as stocks extend lower for the third session in a row. S&P 500 price action fell by more than 1% following the New York opening bell, but equities clawed back downside as trading progressed. Stocks have recently faced selling pressure amid US fiscal stimulus whiplash and mounting coronavirus cases globally. Despite these headwinds still threatening to steer the S&P 500 even lower, VIX Index term structure compression highlights one reason to stay optimistic on stocks.
| Change in | Longs | Shorts | OI |
| Daily | -1% | -2% | -2% |
| Weekly | 17% | -12% | -2% |
VIX INDEX PRICE CHART: FUTURES CURVE TERM STRUCTURE (02 OCT TO 15 OCT 2020)
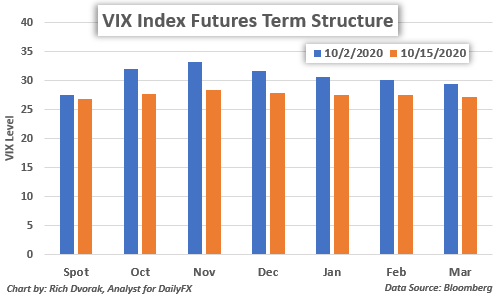
The widening Biden-Trump presidential election spread, coupled with increased odds of a democratic sweep judging by recent polling data, seems to have eased investor concerns over a potential contested election this November. This is conveyed by a flattening of VIX Index futures curve over the last two weeks, which shows reduced hedging costs against potential downside risk around the election. In fact, the November VIX Futures contract closed at the 33.18-level on 02 October, but it now trades nearly 5-points lower at the 28.47-mark.
S&P 500 PRICE CHART: DAILY TIME FRAME (23 APR TO 15 OCT 2020)
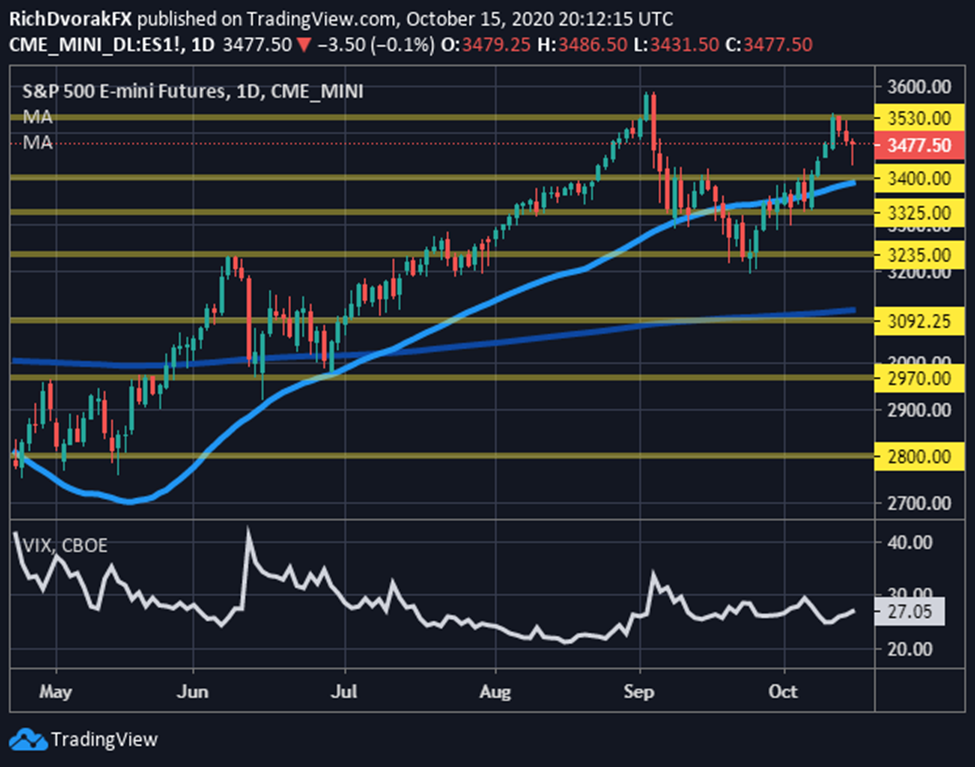
Chart by @RichDvorakFX created using TradingView
Correspondingly, the S&P 500 might rebound back higher with future stock market volatility expectations drifting lower. Angst stemming from fiscal stimulus uncertainty could weigh negatively on stocks in the short-term, but with the prospect of a democratic sweep and even larger stimulus package early next year, the S&P 500 could stay broadly afloat.

Recommended by Rich Dvorak
Get Your Free Equities Forecast
The 3,400-price level on the S&P 500 stands out as a potential zone of technical support. This level of confluence is also noted by its 50-day simple moving average. Breaching this level could open up the door to a re-test of September lows before the 200-DMA comes into focus. That said, Thursday’s bullish hammer candlestick points to potential for a reversal higher following the recent slide in stocks, which brings another look at month-to-date highs into play.
Keep Reading – USD Price Outlook: US Dollar Fueled by Stimulus Deal Volatility
— Written by Rich Dvorak, Analyst for DailyFX.com
Connect with @RichDvorakFX on Twitter for real-time market insight